A few weeks ago while I was studying for a test I noticed that it was exactly the right moment to start working on an Internet of Things related project, something to get some experience before doing actual home automation. Right around that time another question arose that was obviously more interesting than studying: “How fast does a hamster run in its wheel”?
Obviously this meant that a somewhat over-engineered setup needed to be created to answer this question.

Hardware
- ESP8266 (NodeMCU) with ESPurna
- DS18S20 Digital temperature sensor (optional)
- Digital Hall effect sensor (you can also use a reed switch)
- Hamster wheel
- Magnets
- Hamster
The idea is to augment the hamster wheel with magnets, one to measure the rotations over time and the other one as a counter-weight and then count the rotations with a hall effect sensor. Attaching the magnets to the wheel was done using double-sided adhesive tape. The sensor was taped to the hamster cage and the wheel was taped down as well to prevent it from moving away from the sensor too much. In the picture below you can see the temperature sensor taped to the cage as well.

These sensors are connected to a NodeMCU, which is a development board with the cheap and popular ESP8266 (a microcontroller/wifichip) as seen below.

Software
The data needs to be transmitted somewhere for further processing like calculating the actual speed. For that I flashed my NodeMCU with ESPurna. ESPurna is a firmware which has features like over the air updates, transmitting data using MQTT, writing data to influx and much more so if you are interested in making your own home automation systems check it out: ESPurna. While the complexity of this system does not call for using a custom firmware, I wanted to try this one out for future IoT projects. To configure and build the firmware I used PlatformIO which can be used on top of either Atom or VSCode.
To count the rotations I used the Event counter sensor included in ESPurna to measure the amount of rotations and reset the count after it sends out the data. After configuring the temperature sensor with build configuration options, building and uploading the firmware we can connect to an accesspoint made by the firmware and use the included web interface to configure it further. In the webinterface I configured the wifi network to connect to influxdb connection details, MQTT connection details and the data reporting interval (10 seconds).

By default the data of the sensors is sent out using MQTT, which is nice and lightweight, but I did not want to bother (yet) with setting up an MQTT adapter and/or telegraf for collecting data in influx. And because ESPurna can directly write to influx, I configured it to write to a newly launched influx database on my server. Using only MQTT for sending out data keeps the firmware smaller because influx support can be disabled.
Server
Bringing us to the server side of this system. On my server I run using docker:
- Mosquitto, to facilitate MQTT messaging
`docker run --name=mosquitto -it -d -p 1883:1883 -p 9001:9001 eclipse-mosquitto`- InfluxDB, to save time series data
`docker run --name=influx -p 8086:8086 -v </path/to/store/data>:/var/lib/influxdb influxdb`- Grafana, to visualise data in InfluxDB
`docker run -d — name=grafana -p 3000:3000 grafana/grafana`After all the services are up and with the NodeMCU collecting data and writing it to influx we can now proceed to create the visualisations in Grafana.
Data visualization
In the events series we have data points which consists of timestamp and wheel turns in the last 10 seconds. To get the distance we need to multiply the total amount of rounds at a certain point in time, meaning the sum of the current and all the previous values to get the total amount of turns the wheel has made. This value then needs to be multiplied by the circumference of the hamster wheel which is easily obtained by measuring the radius of the wheel, multiplying it by 2*pi. This particular hamster wheel has a radius of 5.5cm, so we get 5.5 * 2 * pi = 34.55 cm. After converting it to meters and rounding it down we get 0.34 as the factor the multiply the rounds per second with.
For the distance chart I use this query, it obtains the total round count at a certain time, then multiplies it by 0.34 to get the total distance the hamster ran in meters at that point in time:
`SELECT cumulative_sum(sum(“value”)) * 0.34 FROM “events” WHERE $timeFilter GROUP BY time($__interval) fill(linear)`The speed is the rate of change of the distance graph. To get the speed we calculate the total of all the rounds in a specific time interval (specified in the group by time part at the end), multiply it by 0.34 to get the distance and then divide it by the time elapsed between this and the previous timestamp/datapoint in seconds. The following query does that and returns the speed the hamster ran at in meter per second:
`SELECT (sum(“value”) * 0.34)/ELAPSED(sum(“value”), 1s) FROM “events” WHERE $timeFilter GROUP BY time($__interval) fill(linear)`
Total distance ran:
`SELECT sum(“value”) * 0.34 FROM “events”`Running more than 25 km in a week is not a problem for this hamster it seems.
To get the top speed I cheated a little bit and use the data reporting interval, basically get the max value for the rounds that the wheel turned, multiply by 0.34 to get the distance and assume these turns happened in at least the data reporting interval (10s) and thus divide it by 10 to get the speed:
`SELECT (max(“value”)*0.34)/10 FROM “events”`We can see that at some point the hamster reached a speed of 1.4m/s or about 5 km/h.

The query for visualising the temperature data is quite straightforward:
`SELECT mean(“value”) FROM “temperature” WHERE $timeFilter GROUP BY time($__interval) fill(null)`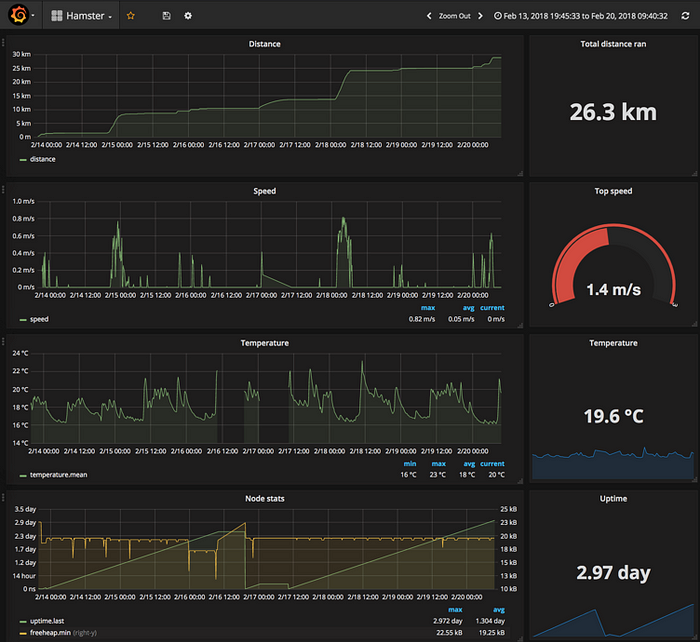
The total setup

Conclusion
That concludes the write up about the hamster metric collection system I built, with the knowledge gained here I hope to build some other “useful” IoT related projects later on.
About the data collected I have to say that hamsters are fast and cover a lot of distance in hamster wheels while going nowhere. 🙂 🐹